Outputs
When finished running, you should get some outputs on the terminal (opened prompt). These include durations and stats. Errors during the run would also appear here.
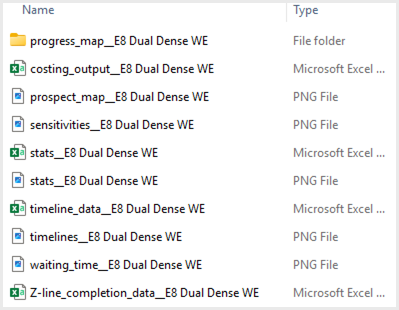
The ‘sardine_outputs’ folder should contain some or all the following files (depending on –charts option) and a folder called progress_map. All of them followed by the name of the Descriptor worksheet of your project.
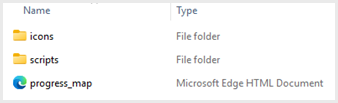
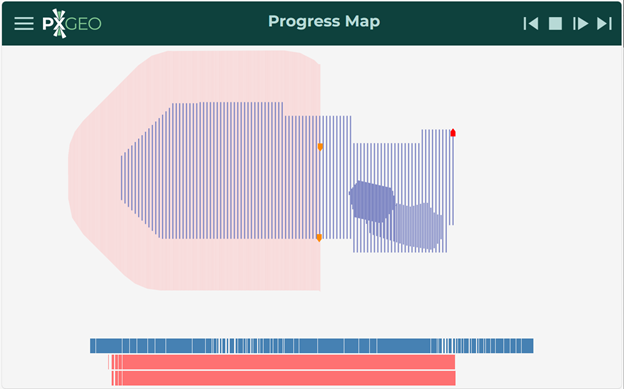
progress_map
Contains progress_map.html, which is a link to an animated plot showing the progress of source and receiver lines. Do not delete the two extra subfolders, they are needed for the html to work.
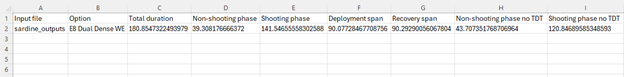
costing_ouput (xlsx)
Contains some values for the number of days of certain events in a .xlsx format. Data: TODO, check
Input file: sardine_outputs, this does not make much sense
Option: name of the descriptor sheet
Total duration: duration of the project in days
Non-shooting phase: number of days without shooting evets
Shooting phase: number of days with shooting events
Deployment span: number of days from first to last deployment (?)
Recovery span: number of days from first to last recovery (?)
Non-shooting phase no TDT:
Shooting phase no TDT:
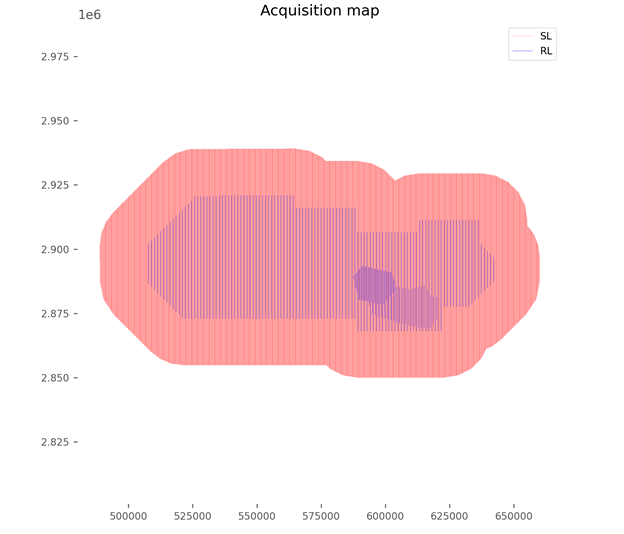
prospect_map (png)
Also called acquisition map. Static polygon showing the source lines (in red) and the receiver lines (in blue).
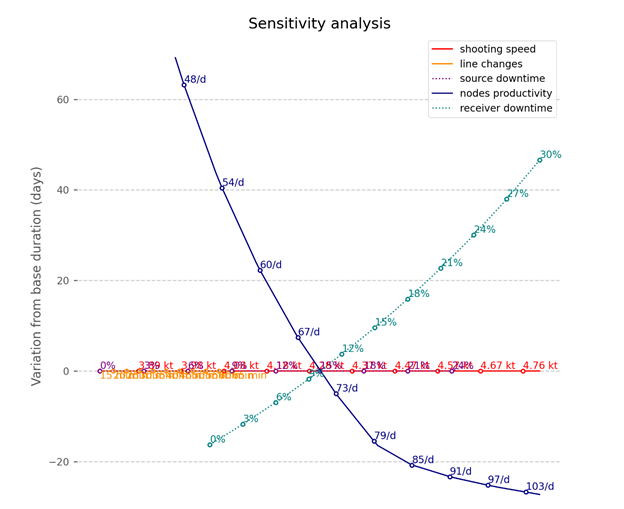
sensitivities (png)
Sensitivity analysis
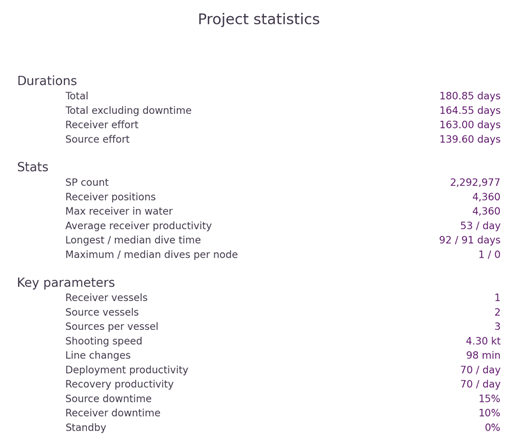
stats (png)
Project statistics, including Durations, Stats and Key Parameters
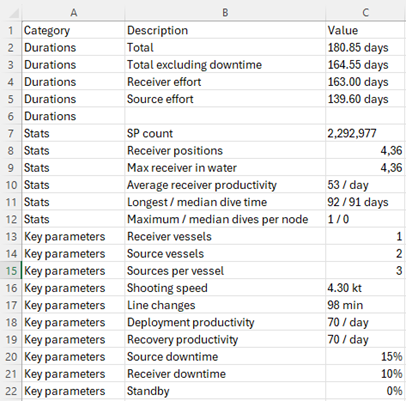
stats (xlsx)
Contains the same information as the png, but in xlsx format.
timeline_data (xlsx)
Contains the values of the timelines in a .xlsx format. The column names are: [‘Vessel Label’, ‘Vessel Count’, ‘Event Name’, ‘Height’, ‘Duration’, ‘Start’, ‘Shot X’, ‘Shot Y’, ‘Deployed X’, ‘Deployed Y’, ‘Recovered X’, ‘Recovered Y’].
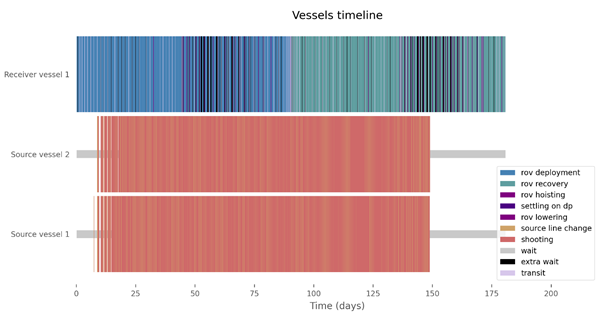
timelines (png)
Timeline of each vessel showcasing the operations. Kinds of operations/events:
Receiver vessel operations:
Rov deployment: rov performing deployment of nodes
Rov recovery: rov performing deployment of nodes
Rov hoisting: bringing the rov back to the deck of the receiver vessel
Transit: a receiver vessel is moving from one receiver line to the next one, it can be either rolling method or no (previously recovering the rov or traveling with it on the water)
Settling on dp: time after the transit and before the rov lowering, I guess its time to settle before lowering the rov, but i do not know exactly what it entails
Rov lowering: getting the rov from the deck of the receiver vessel back into the water
Source vessel operations:
Source line change: a source vessel is moving from one source line to the next one
Shooting: a source vessel is shooting
Generic operations:
Wait: time when the vessel is not active. Note: most of this time would disappear as we implement the ability to choose different start and end dates for each vessel
Extra wait: Corresponds to the extra hours added to the descriptor due to special needs, such as densification, PIES, orthogonal lines…
TODO: document how it is calculated the decision between bringing the rov on deck or transit receiver lines with it on the water, the function is called: _is_bringing_rov_on_deck_more_efficient
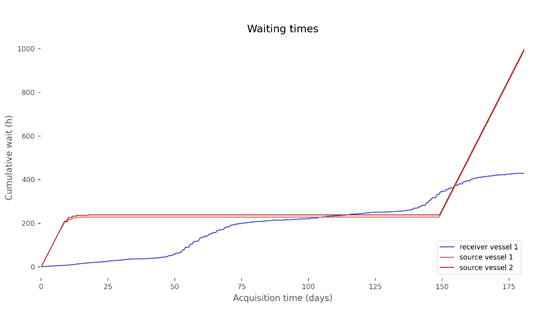
waiting_time (png)
Cumulative wait for all the vessels throughout the duration of the whole project.
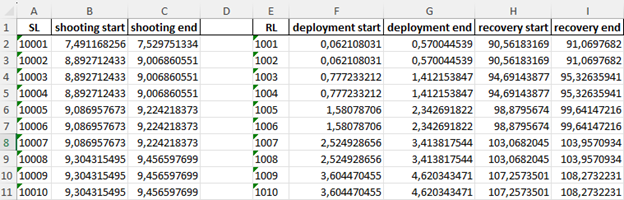
Z-line_completition_data (xlsx)
Contains the values of completition in a .xlsx format. The column names are: [‘SL’, ‘shooting start’, ‘shooting end’, ‘’, ‘RL’, ‘deployment start’, ‘deployment end’, ‘recovery start’, ‘recovery end’]
Requirements
ID |
Title |
Status |
|---|---|---|
Execution environment |
open |
|
The Seismic Grids plugin shall be compatible with QGIS version 3.0 or higher. |
open |
|
The system shall allow manual overrides and adjustments to sequences and parameters. |
open |