MantaDesign
MantaDesign is a Microsoft Excel Macro-Enabled Worksheet (xlsm) used by the commercial department and the operations crew in the workflow of OBN projects.
Although the final goal when using MantaDesign is to run Sardine, this wordbook is heavily used as a tool to easily handle data in intermediate steps: manually reorganize, modify or add values when needed for a project.
The main worksheet inside MantaDesign is called ‘SARDINE’. This sheet contains the Macros code to run the Sardine executable, and the parameters used by the code.
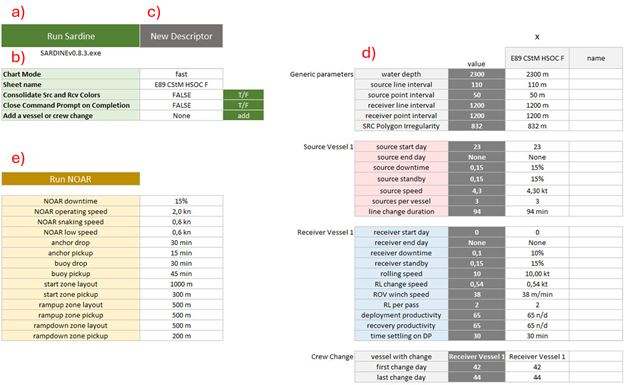
When running Sardine (a), the Macros will also use the commands in light green cells on the left-hand side of this worksheet (b). They are the available Command Line Options:
- Chart Mode: Select the type of charts to be generated. Options include:
fast: Generate only the key charts quickly
all: Generate all available charts
none: No charts will be generated, only terminal prints
sensitivities: Generate only sensitivity charts
- Sheet name: Name of the Descriptor sheet to run.
It also must correspond to a name in row 3, where the columns of values are labeled in a grey cell by the name of the descriptor sheet. This match between ‘Sheet name’ and a column of values is what makes the main column of values (column ‘I’, dark grey) to show those values. If you change the ‘Sheet name’, the Macros will look for a column of values with that exact same name to display its values in the dark grey column.
- Consolidate Colors Src and Rcv:
TRUE: Consolidates all receiver deployment and recovery activities to a single color (blue), and all source activities to another single color (red). This is intended to simplify the timeline for clients, applies to both the timeline png and the html progress map
FALSE: Gives a different color to each activity in the timeline, which helps with the analysis.
- Close Command Prompt on Completion:
TRUE: Closes the prompt window immediately after execution.
FALSE: Keeps the prompt window open after execution.
- Add a vessel or crew change:
None: Does nothing when ‘add’ is clicked
Source: When ‘add’ is clicked, a new section of parameters will appear below your last parameter. This section will be a copy of the ‘Source Vessel 1’ section and it will be named the same way, updating the number as more vessels are added. There is no limit to the number of vessels to add.
- Receiver: When ‘add’ is clicked, a new section of parameters will appear below your last parameter. This section will be a copy of the ‘Receiver Vessel 1’ section and it will be named the same way, updating the number as more vessels are added. There is no limit to the number of vessels to add.
Note: do not remove ‘Source Vessel 1’ nor ‘Receiver Vessel 1’ sections, as the Macros counts on having at least always those first source and receiver vessels.
- Crew Change: When ‘add’ is clicked, a new section of parameters will appear below your last parameter. This section will always be named ‘Crew Change’. There is no limit to the number of crew changes to add.
Note: it is safe to remove all the crew changes.
New Descriptor cell (c): when clicked, it generates a new sheet copying the hidden worksheet ‘DescriptorTemplate’ and naming it under the value of ‘Sheet name’, in cell C5. If empty, the name defaults to ‘Descriptor’.
The right-hand side table of SARDINE sheet (d) is the area destined to include the different projects and their parameters. When running Sardine, all the projects with an ‘x’ in the cell above them will run from left to right. For a project to correctly run, the name at the top of the parameters must be the same as the name of the new Descriptor sheet containing its data.
To read more information on the different parameters see the ‘Parameters’ section.
NOAR or ‘Node On A Rope’ (e) is a different method to OBN. It is less used but shares the code with Sardine, so it is included in the sheet. We will not go into detail about NOAR, although it’s a resource that should be kept available, as they use it for other purposes.
The Descriptor sheet is also an important part of the workflow: some data will be added to it, mainly from QGIS but also manual calculations. Later, the Sardine code will use columns A-U as input (Source and Receiver lines, SRC and RCV sequence). This is how the headers of a new Descriptor worksheet look like:
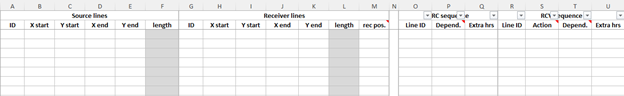
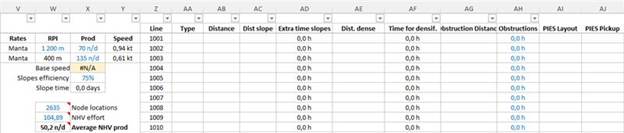
Where columns V and on are used as only as intermediate tools to calculate the extra hours for the sequence (columns Q and U).
Those extra hours are used for: densification, obstructions, PIES, platforms and to open gaps (crew changes, vessel delays…). In the case of in line densification: in column W they set up the different RPI and in column X they set the productivity. Then, they fill out column AE with the length of the in line densified receiver lines.
There is also a series of Hidden worksheets that won’t be explained in this document, but whose names are: ‘MR Calc Deep’, ‘MR Calc Shallow’, ‘ROV Calc’, ‘scenarios’ and ‘Source Rec Calc’.
Requirements
ID |
Title |
Status |
|---|---|---|
The system shall allow users to create and manage OBN projects using MantaDesign and QGIS. |
open |
|
The workflow shall support input from client specifications, including polygons, intervals, and vessel parameters. |
open |
|
The system shall generate seismic grids and sequences using the Seismic Grids QGIS plugin. |
open |
|
The Sardine executable shall be triggered via macros in the MantaDesign Excel workbook. |
open |